
Ton-Texter consists of many different components. To get an overview of what’s happening it is important to have one central place for logs and all important metrics. Therefore, we use AWS Cloudwatch.
To get an overview of our infrastructure consider reading: How we built our own ‘serverless’ GPU cloud infrastructure
Table of Contents
Open Table of Contents
AWS Cloudwatch
In search of one central place for all our applications logs and metrics we stepped across AWS Cloudwatch:
Amazon CloudWatch monitors your Amazon Web Services (AWS) resources and the applications you run on AWS in real time. You can use CloudWatch to collect and track metrics, which are variables you can measure for your resources and applications.
You can additionally create custom dashboards to display metrics about your custom applications, and display custom collections of metrics that you choose.
At the time only the logs of our lambda functions to start and stop machines were already visible in Cloudwatch. We had to find solutions to add the logs of our Next functions, our EC2 instance and the python application running on that instance to Cloudwatch.
Additionally, we wanted to get metrics for the usage of the CPU and GPU of our EC2 machines to make sure that they are effectively used by our transcription application.
How we track a process across the infrastructure
To be able to track one transcription process across the entire infrastructure we introduced a process id that is a part of all logs related to the process. Like this we can query our logs with the process id and get the relevant logs for a specific process.
Our process id consists of the already existing users id and transcript id. Both of these are unique, that way it is ensured that the process id is unique as well.
The format for the process id is: userId.transcriptId
The user id and transcript id were available in the EC2 python application and the Next.js backend functions already as they are a part of the transcript object, therefore we just had to pass this information additionally to the lambda function to start instances.
EC2 logs on Cloudwatch
The most important part of our pipeline is running on EC2 machines. On our machines we have three separate log files:
init.log: Log file of the user data script that is executed on the first launch of the machine to install packages, pull our Python application from Github and setup the autostart script to launch the application on the reboot of the machine.startup.log: Log file of the autostart script that pulls / updates the application and launches it.Python-Transcription-Application.log: Log file of the python application for the transcription.
To pass these logs to Cloudwatch we have to setup the Cloudwatch agent on our EC2 machines.
The unified CloudWatch agent enables you to do the following:
Collect internal system-level metrics from Amazon EC2 instances across operating systems. The metrics can include in-guest metrics, in addition to the metrics for EC2 instances. The additional metrics that can be collected are listed in Metrics collected by the CloudWatch agent.
- Collect system-level metrics from on-premises servers. These can include servers in a hybrid environment as well as servers not managed by AWS.
- Collect logs from Amazon EC2 instances and on-premises servers, running either Linux or Windows Server.
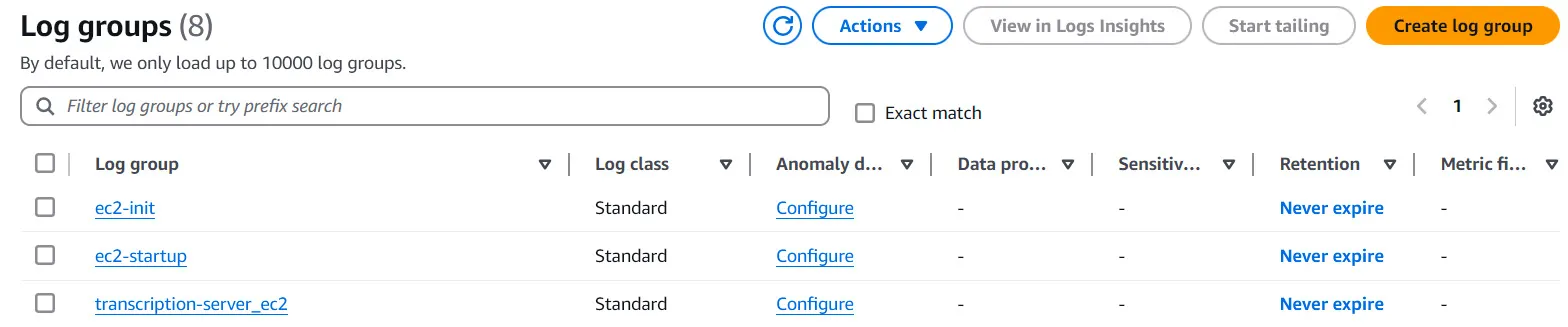
The Cloudwatch agent can track changes in local log files and pass these changes on to Cloudwatch logs. In Cloudwatch, logs can be summarized in log groups. We decided to create separate log groups for the three individual files / log streams. The following image showcases the log groups in Cloudwatch:
To setup the Cloudwatch Agent we create a config file as a part of the user data script that initializes our EC2 machine. We setup the three above mentioned log files as the logs_collected:
# Create Amazon CloudWatch Agent config file
sudo mkdir -p /opt/aws/amazon-cloudwatch-agent/bin/
sudo tee /opt/aws/amazon-cloudwatch-agent/bin/amazon-cloudwatch-agent.json > /dev/null <<EOL
{
    "logs": {
        "logs_collected": {
            "files": {
                "collect_list": [
                    {
                        "file_path": "/var/log/Python-Transcription-Application.log",
                        "log_group_name": "transcription-server_ec2",
                        "log_stream_name": "{instance_id}",
                        "timestamp_format": "%Y-%m-%d %H:%M:%S"
                    },
                    {
                        "file_path": "/var/log/init.log",
                        "log_group_name": "ec2-init",
                        "log_stream_name": "{instance_id}",
                        "timestamp_format": "%Y-%m-%d %H:%M:%S"
                    },
                    {
                        "file_path": "/var/log/startup.log",
                        "log_group_name": "ec2-startup",
                        "log_stream_name": "{instance_id}",
                        "timestamp_format": "%Y-%m-%d %H:%M:%S"
                    }
                ]
            }
        }
    }
}
EOL
To apply the config the CloudWatch Agent must be started / restarted. Therefore, we add the following code snippet to the user data script:
# Start Amazon CloudWatch Agent
sudo /opt/aws/amazon-cloudwatch-agent/bin/amazon-cloudwatch-agent-ctl \
    -a fetch-config \
    -m ec2 \
    -c file:/opt/aws/amazon-cloudwatch-agent/bin/amazon-cloudwatch-agent.json \
    -s
The Cloudwatch Agent is now configured and will start automatically when the instance is launched. One important thing to remember is that the EC2 machine needs permissions to interact with Cloudwatch. The setup of our IAM policy to grand these permissions to our machine is introduced in the next section of this article.
Track transcription process in Cloudwatch
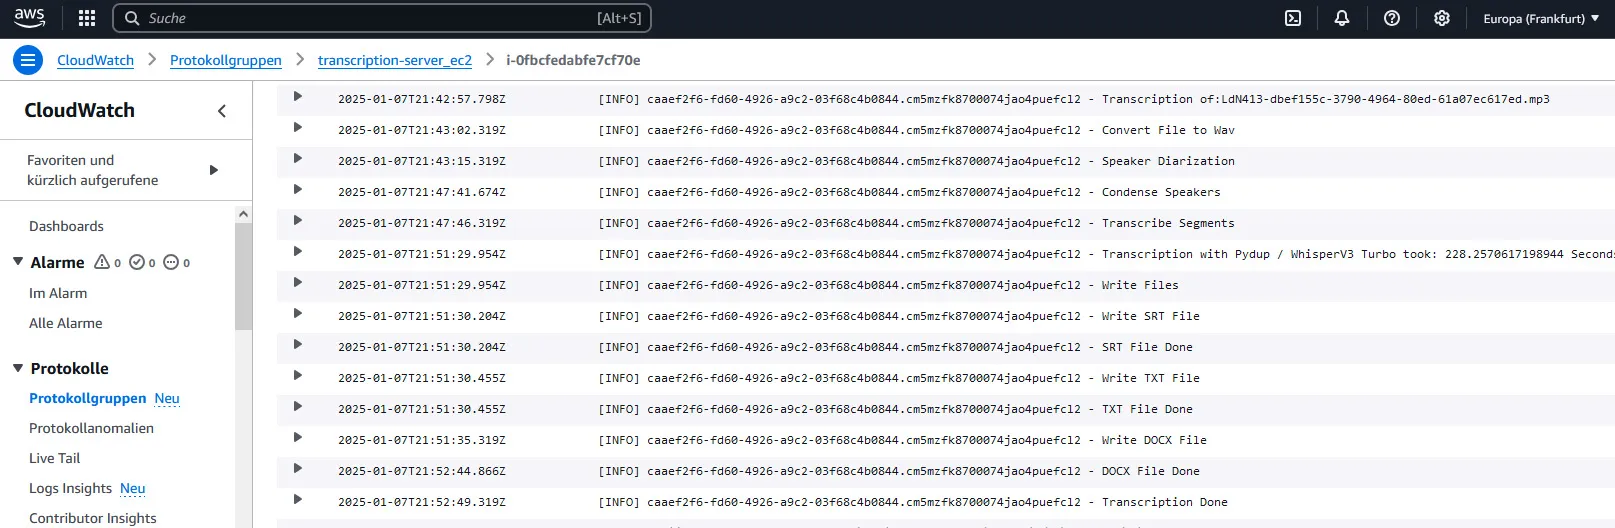
The following image shows the logs of the python application running on the ec2 of an exemplary transcription in Cloudwatch:
EC2 additional metrics - track GPU usage
GPU usage is not a part of the standard AWS metrics for EC2 machines, but it is the most important metric for us as it is crucial for us to see if the machine learning models of our application are running on the GPU, as it would be way slower if they would run on the CPU because of a Pytorch misconfiguration. Additionally we want to track how efficiently we are using the hardware of our EC2 instance.
To setup the collection of GPU metrics we had to add the following snippet to the previously shown amazon-cloudwatch-agent.json as it is described in Collect NVIDIA GPU metrics:
    "metrics": {
        "metrics_collected": {
            "nvidia_gpu": {
                "measurement": [
                    "utilization_gpu",
                    "utilization_memory",
                    "memory_total",
                    "memory_used",
                    "memory_free",
                    "clocks_current_graphics",
                    "clocks_current_sm",
                    "clocks_current_memory"
                ],
                "metrics_collection_interval": 10
            }
        }
    }
Another helpful source is: Capturing GPU Telemetry on the Amazon EC2 Accelerated Computing Instances
Because the runtime of our machines can be just a minute or two we decided to set the metrics_collection_interval to 10 seconds to get a detailed understanding of our GPU usage in the different stages of our transcription process.
Remember to give the EC2 permission to write logs and send metrics to CloudWatch:
# Policy for CloudWatch Logs
resource "aws_iam_policy" "cloudwatch_logs_policy" {
  name        = "cloudwatch_logs_policy"
  description = "Policy for EC2 to write logs and metrics to CloudWatch"

  policy = <<EOF
{
  "Version": "2012-10-17",
  "Statement": [
    {
      "Effect": "Allow",
      "Action": [
        "logs:CreateLogGroup",
        "logs:CreateLogStream",
        "logs:PutLogEvents",
        "logs:CreateLogDelivery",
        "logs:UpdateLogDelivery"
      ],
      "Resource": "arn:aws:logs:*:*:*"
    },
    {
      "Effect": "Allow",
      "Action": [
        "cloudwatch:PutMetricStream",
        "cloudwatch:PutMetricData",
        "cloudwatch:ListMetrics"
      ],
      "Resource": "*"
    }
  ]
}
EOF
}
GPU usage at transcription
In the following graph we can see both the gpu utilization and the memory utilization across the transcription of two large audio files:
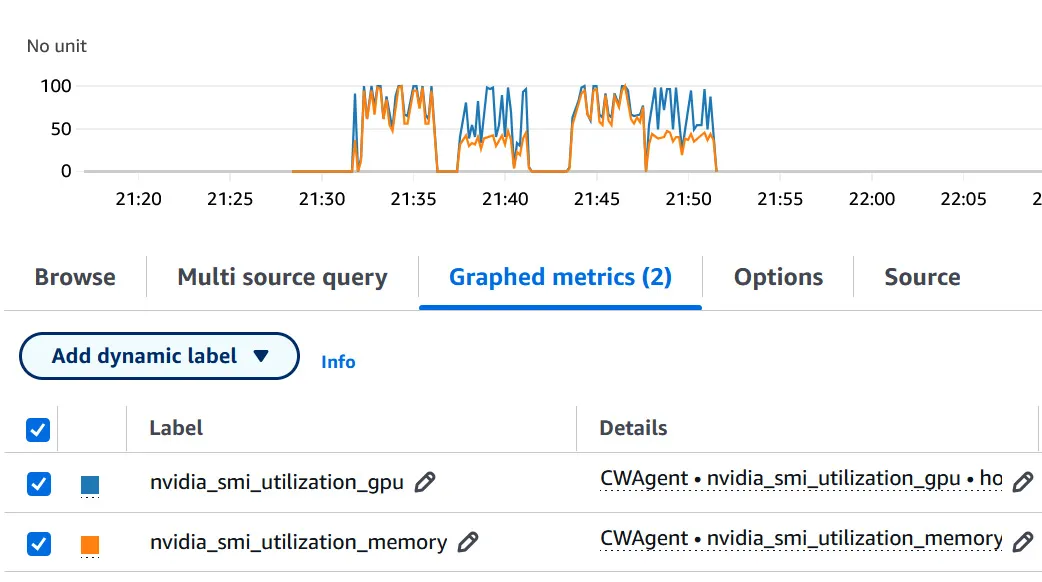
As we can see above the application uses 100 percent of the GPU whilst performing speaker diarization and transcription. From the graph we can clearly see the differentiation between the first step, speaker diarization with Pyannote, which uses 100 percent of the GPUs memory and the second step, transcription with Whisper, which uses around 50 percent of the memory.
If you want to learn more about how Ton-Texter transcription works, consider reading: The backbone of Ton-Texter - Transcription based on OpenAI Whisper / Pyannote
We can conclude that we manage to use the resources of the EC2 instance effectively.
Next.js logs on Cloudwatch
To collect logs in our Next.js backend we use the AWS JavaScript v3 SDK:
How we retrieve useful information from our logs
With the Logs insights integrated in AWS Cloudwatch we can query our logs / logs from selected log groups. As mentioned in the beginning of the article, all of our logs contain the process id that is the combination of the user id and transcript id.
For our load tests we use a specific test user. To get the logs related to the test run we can query for all log messages with the test users id. The following snipped shows the query in Logs insights:
fields @timestamp, @message
| filter strcontains(@message, "ae7bd96f-b548-4ff9-814a-15d304859476")
This how the result of the query is displayed in Cloudwatch:
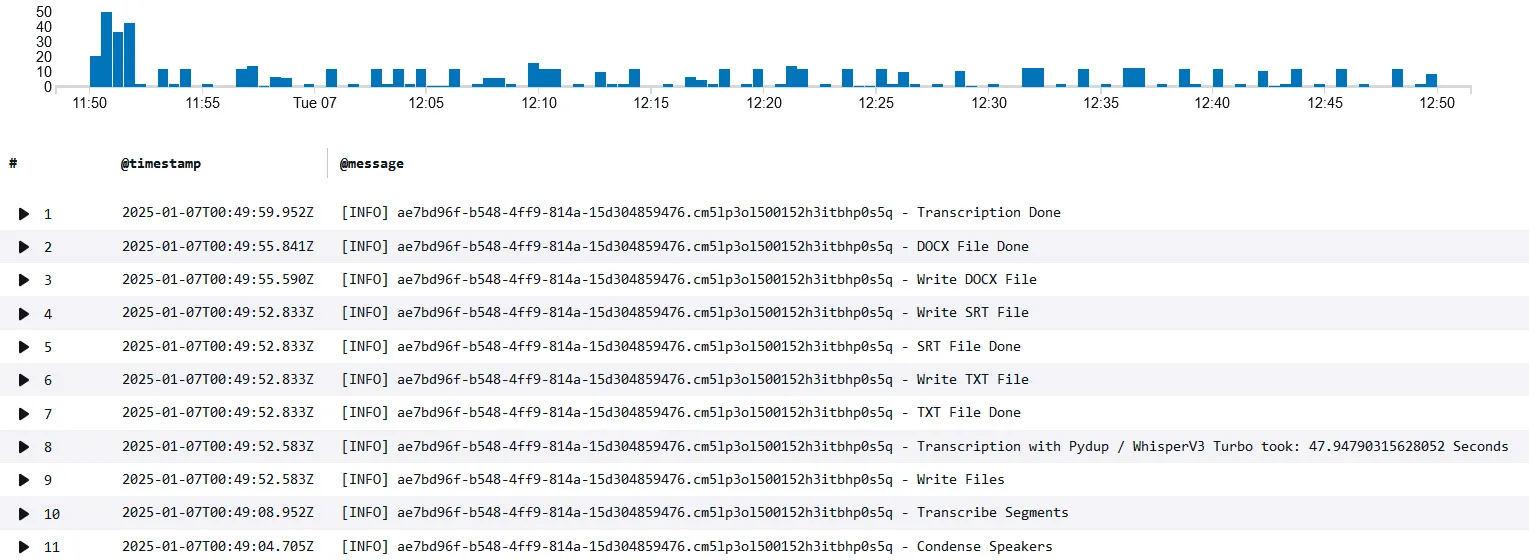
The chart on top shows the number of messages throughout the time of the test run.
To test the capabilities of Ton-Texter we used Apache JMeter, a tool to simulate large traffic / to stress test an application, to see how long it would take Ton-Texter to process a sudden demand of 10 hours of audio material, divided in a number of 40 files with different lengths.
We can see from the chart above that there is an initial peak of log messages when the traffic is processed by Next.js and added to the database / queue. Later on we can see that the transcription tasks are processed one by one by the EC2 instance.
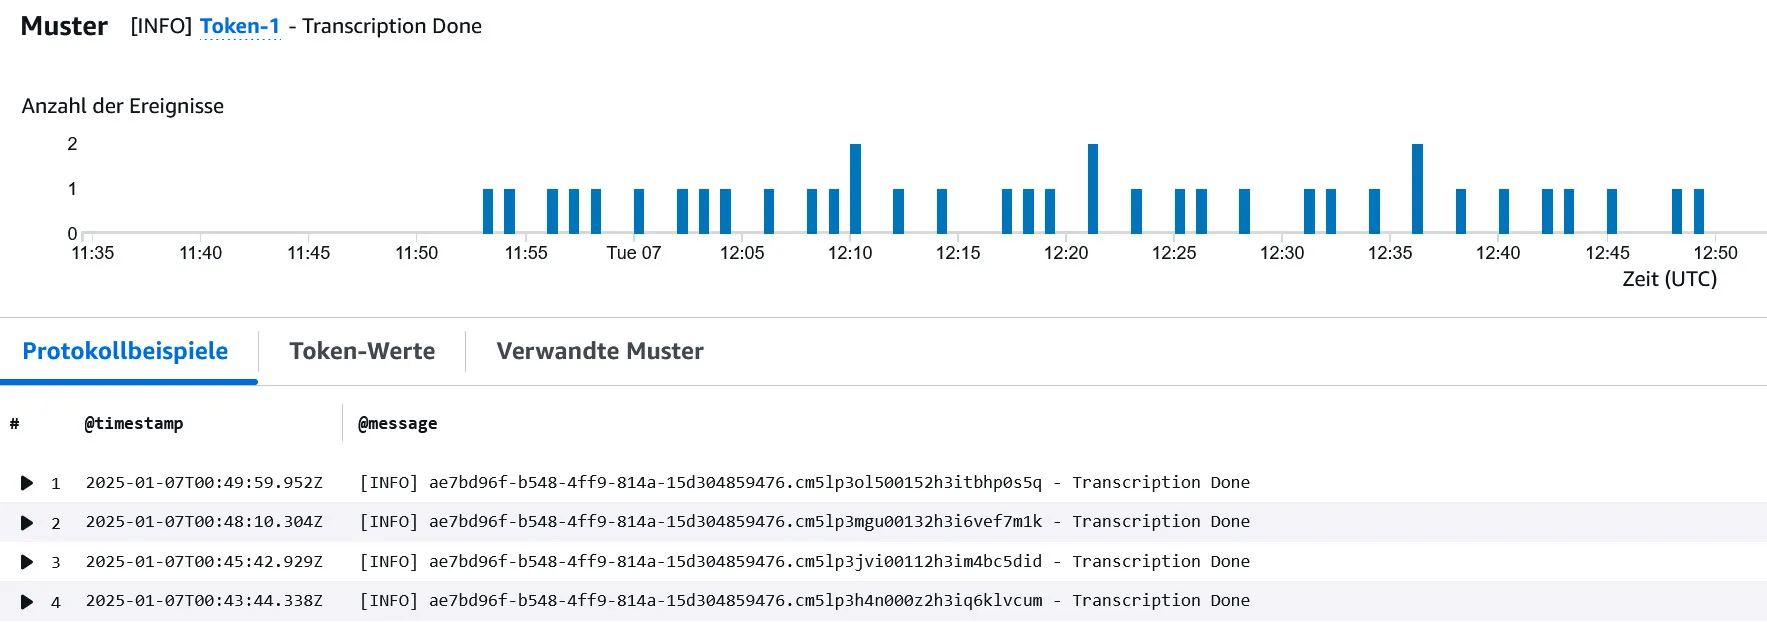
Patterns
Logs insights automatically detects patterns within the log messages of the query result. By filtering the results like that we can get on overview of different steps in our process, for example when our individual transcriptions are done:
Conclusion
Through the introduction of centralized logging in AWS Cloudwatch we can get an overview of a transcription process in one place and get a fast understanding of potential errors. The logs and metrics are also crucial to get an understanding of the performance and capabilities of our application and improve its reliability.
If you want to read more about how we stress test our application consider reading: Can Ton-Texter keep up?! - simulating high traffic with Apache JMeter